Cyprus (or the Republic of Cyprus) is a country in the Mediterranean Sea. It's an island nation and the third largest and most populous place in the Mediterranean. Surrounding it are Egypt, Greece, Turkey, Syria, Israel, Palestine, and Lebanon.
As Europe's sunniest island, it welcomes sunshine more than 300 times a year, which gives one a significant reason to visit and explore the destination. Scattered across the country are white sand beaches, Mediterranean forests, iconic monuments, and striking architecture. It also has an active nightlife (in its largest cities), good food, and fine wine!
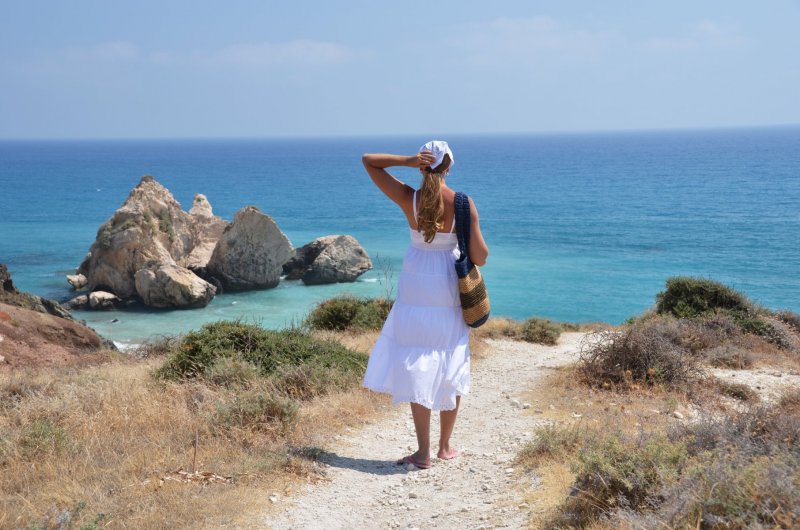
Cyprus is a small island located in the Mediterranean sea near Greece. This island is the birthplace of the ancient Greek goddess Aphrodite. This is a very beautiful place with many wonderful beaches, archeological sites, and modern-day attractions like zoos or aquariums. The wide variety makes it a great vacation spot for history buffs, art lovers, or beachgoers.
1. The Adonis Baths:
This gorgeous swimming hole has many hiking trails and waterfalls that surround the area. Visitors can swim, hike, go biking, get a mud treatment, and look at the beautiful statues of the two gods there. There’s also a small museum where people can learn about the stories of Aphrodite and Adonis. The swimming hole itself has tons of rope swings guests can use to jump into the cool waters. If you’re looking for a little more thrill, there are four-wheeling trips to go on.
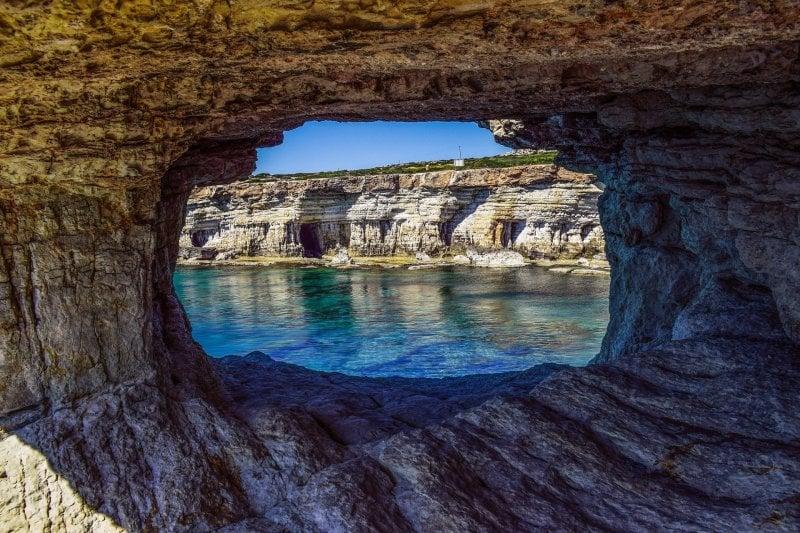
2. Cape Greco:
Another wonderful swimming area for people to see is the beach known as Cavo Greco or Cape Greco. This is a national park that has caves for adventures to explore. Several nature trails offer breathtaking views of the sea and cliffs. You can also go snorkeling, cliff diving, and have picnics near the Agioi Anargyroi Church. As for the caves, people are only allowed to snorkel around them or walk them during low tides.
3. Paphos Mosaics:
If you’re more into art and history than swimming and hiking then this site is for you. Near the Paphos harbor, there are well-perserved mosaic floors to admire. The mosaics are from the Hellenistic/Byzantine period and are inside the villa of Dionysus, Thesus, Aion, Orpheus, and the four seasons. The best one being the one in the Dionysus villa. Around the mosaics, visitors can also see many tombs, palaces, theaters, and other ancient buildings.
4. Limassol Museum:
Another perfect spot for history buffs to see is the Limassol museum that was founded in 1948. This place has displays of pottery, metal works, and marble workings that date back to the Neolithic and late Roman periods. The gallery was once a part of the Limassol Castle but has been relocated to a separate building nearby. Again this is a fun location for someone who wants to see how the island of Cyprus developed over the years.
5. Nissi Beach Resort:
This is one of the more modern tourist destinations located on the island. The resort is in Ayia Napa and is a perfect honeymoon/wedding venue for young couples to go to. The resort has tennis courts, a huge gym, a spa, many pools for non-beach goers, live music, water sports, and more. While we understand some people might prefer to hang inside and play some online slots, this attraction isn't worth missing! The beach itself is huge with white sands, blue waters, and optimal lounge sites.
These are some of the areas to go to in Cyprus. Of course, there are more places to visit that aren’t mentioned in this list. Please look into this wonderful vacation destination.
The oldest wine in the world is officially still in production in Cyprus is named Commandaria. Today, the local grapes are much in demand, and some of the vines are hundreds of years old. Winery tours are a popular way to learn more about the subject.
Cyprus is renowned for its fabulous beaches. For those looking for seclusion, then Makronissos Beach is the place to head for. Sports enthusiasts will particularly enjoy Coral Bay with its clean, safe water for swimming and scuba diving. Fig Tree Bay is the best option for families.
The biggest party town in Cyprus is Ayia Napa, which is thronged by youngsters every summer looking for the best nightlife. The main square has plenty of fun bars with different themes, and there is a Hard Rock Cafe for those who enjoy live music.